SERVICES
Business Intelligence
We turn your scattered data in Excel, ERP, and databases into clear dashboards and actionable KPIs. We separate operational reporting (daily state of the business) from predictive analytics (anticipating trends and demand). With Power BI, Microsoft Fabric, and modern data architectures, we integrate, model, and visualize your information so you can make decisions based on data, not intuition.
Why choose Business Intelligence?
At Q2BSTUDIO we help companies to extract value from their data. We unify the information that today lives dispersed in Excel sheets, ERPs, CRMs and databases, and transform it into interactive dashboards and KPIs that answer the key questions of your business.
We distinguish two levels of analytical maturity: operational reporting (status dashboards for day-to-day use) and predictive analytics (statistical models and machine learning that anticipate trends, demand or behaviors). Not all businesses need both from day one; We accompany you step by step according to results.
We work with Power BI as our main tool (we are a Microsoft partner), complemented by modern data platforms such as Microsoft Fabric, Azure Synapse and Azure Data Factory. When the project requires it, we also integrate Tableau, Qlik, Databricks or Snowflake.
We cover the full data cycle: source connection and integration (ETL/ELT), modeling with semantic governance (unique definitions of metrics and dimensions), creation of a data warehouse, design of dashboards oriented to decision-making, automation of reports and advanced or predictive analytics with Python when it adds value.
We don't just deliver a pretty dashboard: we take care of data quality (cleansing, validation, traceability), ownership (who is responsible for each metric) and semantic governance (a single version of the truth), permissions by role and security, and we train your team to gain autonomy. Medium category ENS certification and Microsoft partner for projects that require security and compliance.
WHAT'S INCLUDED
Business Intelligence solutions we develop
Dashboards and dashboards with Power BI
Design and development of interactive dashboards with Power BI: we connect your data sources, model the information and create clear dashboards with the KPIs that move your business.
View solution →Data Integration and Modeling (ETL/ELT)
Extract, transform, and load data from your sources into a clean, consistent model. ETL/ELT with Azure Data Factory, Microsoft Fabric and open-source tools.
View solution →Data warehouse and data architecture
Design and deploy data warehouses and modern data architectures with Microsoft Fabric, Azure Synapse, and SQL Server to centralize your insights and feed your analytics.
View solution →Automated reports and KPIs
Automation of periodic reports and KPI monitoring with Power BI and Microsoft tools: distribution by email or Teams, alerts and subscriptions without manual intervention.
View solution →Predictive and advanced analytics
Forecasting models with Python, machine learning, and Power BI to anticipate trends, demand, risk, and behaviors based on your historical data.
View solution →Migration from Excel to Business Intelligence
We turn your Excel sheets into a professional BI environment with Power BI: automation, consistent data model, permissions, and removal of runaway versions.
View solution →Power BI embedded in your apps
Integration of Power BI dashboards within your web applications, customer portals, and SaaS platforms with Power BI Embedded and per-tenant security.
View solution →Data governance and quality
We define ownership, semantic governance, quality rules and access policies so that your data is reliable, traceable and has a clear owner.
View solution →Power BI and data culture training
Hands-on in-company training in Power BI, DAX, data modeling, and data culture for your team to gain autonomy and make decisions based on reliable information.
View solution →
TECHNOLOGIES
- Python
- PostgreSQL
- Microsoft SQL Server
- Microsoft Azure
- Power BI
- Tableau
- Qlik Sense
- Databricks
- Snowflake
- Microsoft Fabric
- Azure Synapse Analytics
- Azure Data Factory
HOW WE WORK
Our development process
Diagnosis of sources and needs
We identify what data you have, where it is, and what business questions you want to answer to define key KPIs.
Data Integration and Modeling
We connect the sources, clean and transform the data (ETL/ELT) and build a coherent data model.
Design of dashboards and KPIs
We create interactive, clear, and action-oriented dashboards, validated with end users.
Validation and implementation
We verify the accuracy of the data, set up automatic permissions and updates, and publish the reports.
Training and ongoing support
We train your team, evolve dashboards and provide support so that BI continues to grow with you.
CASES
Business Intelligence projects
 Development+9
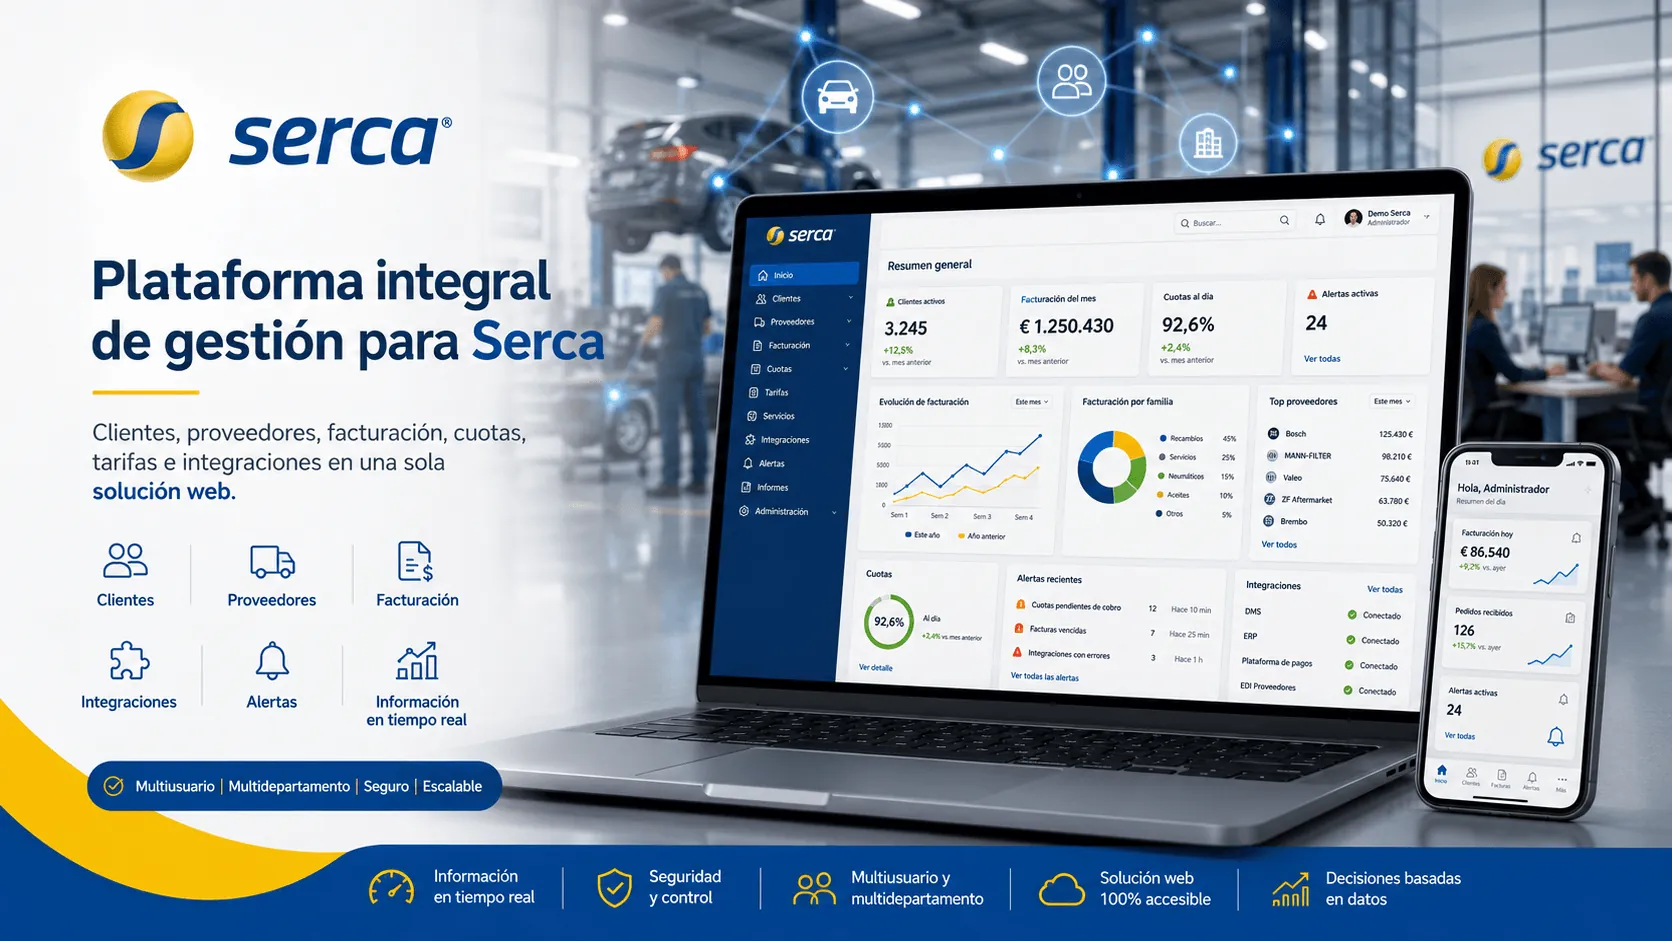
Serca — Plataforma integral de gestión para clientes, proveedores, facturación e integraciones
E-commerce / online store +8
Industry · Education and EdTech
JavaScriptC#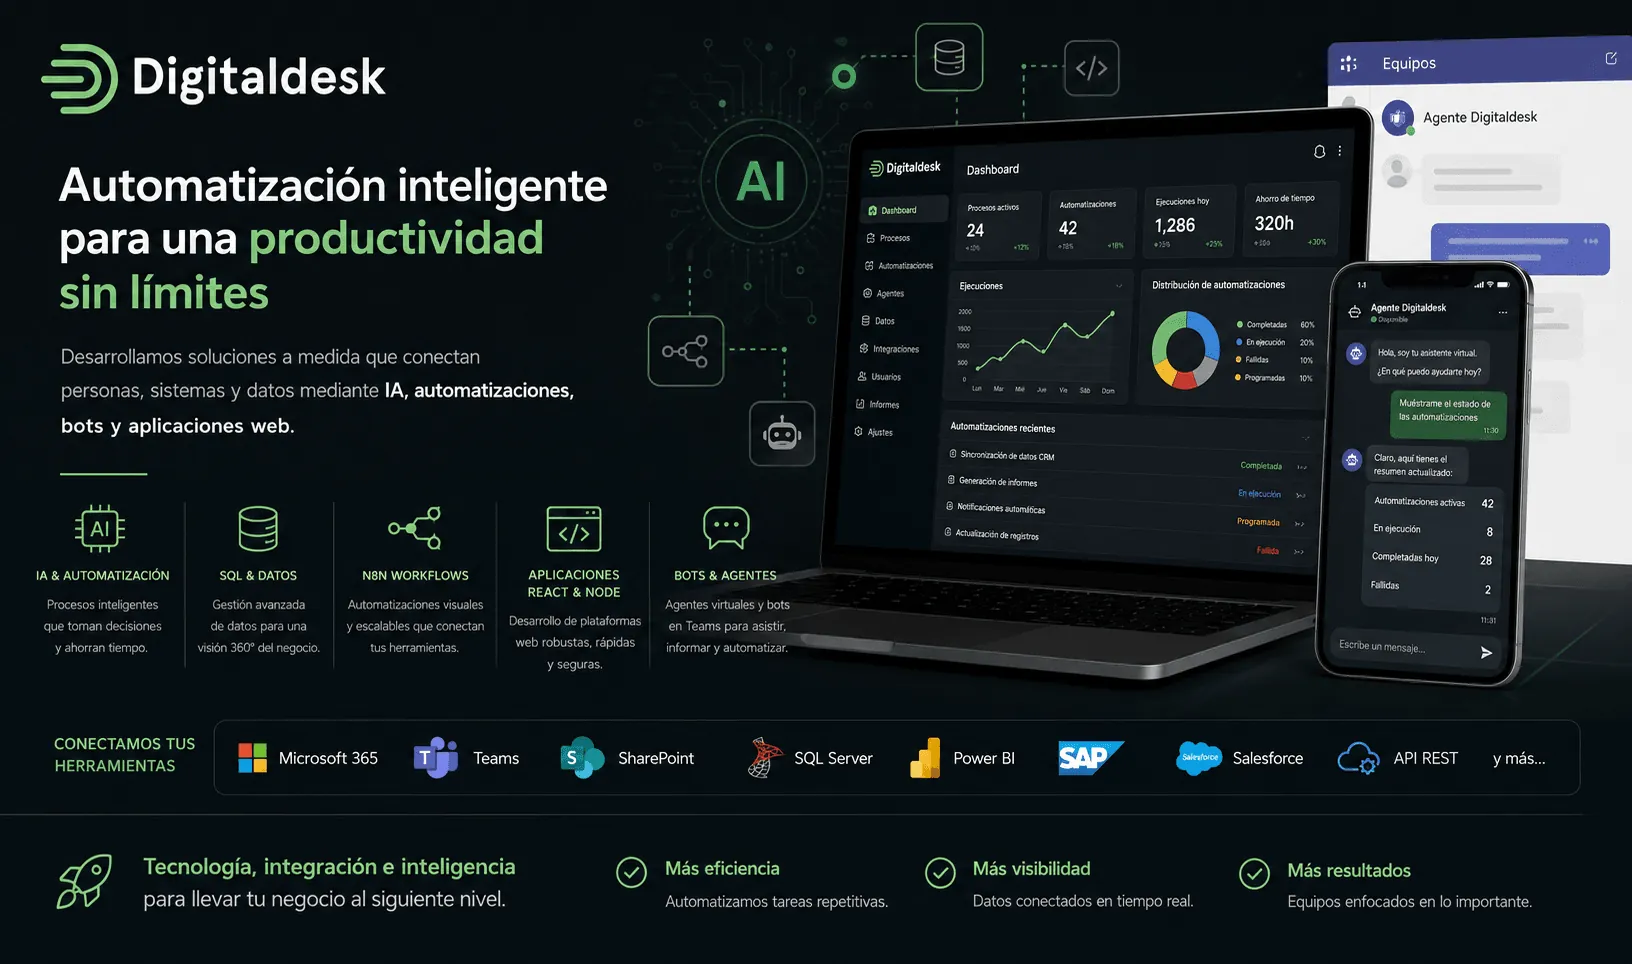 Development+11
Digitaldesk — Automatización inteligente para conectar sistemas, datos y equipos
Mobile App (iOS / Android) +10
Industry · Professional Services
JavaScriptC#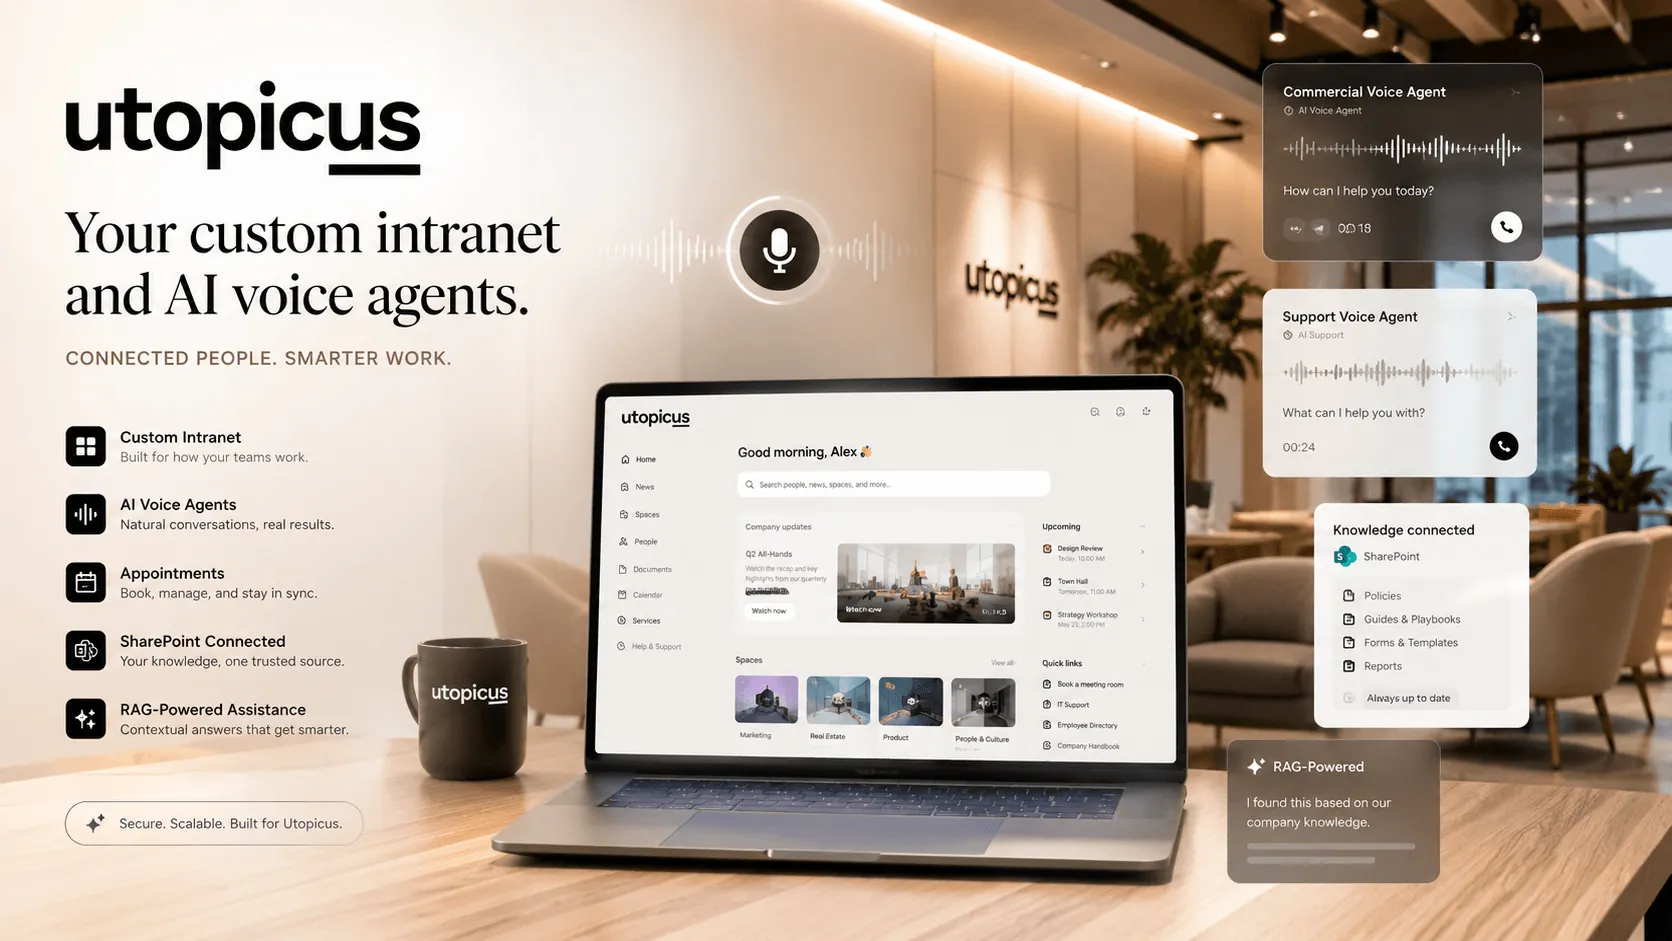 Development+7
Utopicus — Intranet corporativa y agentes de voz con IA conectados al conocimiento interno
Web / SaaS platform +3
Industry · Real Estate & PropTech
JavaScriptC#
FREQUENTLY ASKED QUESTIONS